Using Mozilla in testing and debugging web sites
Mozilla is a great tool to use in developing web sites and web applications. Not as a development tool itself, like an editor, but as a testing and debugging tool. Here I describe some very cool features in Mozilla which will enable you to quickly find and debug errors in your web site and web applications. Used applications have been using Mozilla 1.4a and Internet Explorer 6.0 SP1 on Windows XP.
This page is also available in the following languages: French, Simplified Chineses
JavaScript Console
A lot of the errors found in todays web pages and web applications are caused by JavaScript errors. Most of the time they're very simple errors. This is in my opinion the most common reason why sites doesn't work in Mozilla. But these errors could easily be avoided.With Internet Explorer you are, if you have set the correct setting, presented with an almost useless dialog that "page contains errors". The dialog doesn't let you copy the error to the clipboard for starters. If you want better debugging in Internet Explorer you can install the Microsoft Script Debugger which is a debugging environment for scripting in Internet Explorer.
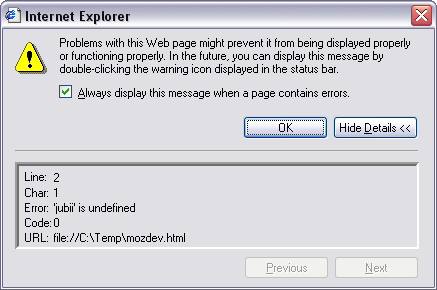
Picture 1: JavaScript error in Internet Explorer
With Mozilla on the other hand you have the JavaScript Console. All JavaScript errors are logged here. So if you keep the JavaScript Console open while testing your site you can on-the-fly see if there are any JavaScript errors. An indispensable tool for developing web sites and web applications.
The JavaScript Console reports the error and the filename and the line number. Furthermore the context of the error is shown. This makes it very easy to get a clue about where the error is and what caused it.
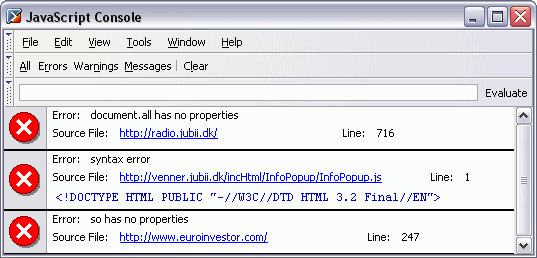
Picture 2: The Mozilla JavaScript Console with errors
You can right-click on each error and copy it to the clipboard. The JavaScript Console could still need a lot of improvements. You can't save all entires to a file and it has problems with wrapping.
The JavaScript Console can be started via Tools -> Web Development -> JavaScript Console.
JavaScript strict warnings
JavaScript strict warnings are messages that are produced inside the JavaScript Engine, which is in the core of the browser. JavaScript strict warnings are produced in all browsers. In both Mozilla and Internet Explorer and Opera. But only Mozilla shows them.JavaScript strict warnings are warnings from the JavaScript Engine about some mistakes in the client side JavaScript code. These mistakes, unlike JavaScript errors, do not stop the execution of the web page. But they do slow it down a bit, since they produce an exception inside the JavaScript Engine.
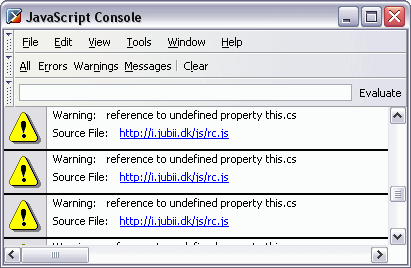
Picture 3: JavaScript strict warnings
In other browsers than Mozilla these exception are not available to the developer but with Mozilla you can access these warnings. This puts you in the driver seat for making 100% valid JavaScript code!
A common mistake in JavaScript is to declare a variable twice:
var response = true;
var response = false;
This will produce a JavaScript strict warning saying
"redeclaration of var response"
The correct way is of course:
var response = true;
response = false;
The JavaScript Console can be enabled in nightly builds via Edit -> Preferences -> Debug -> Show Strict JavaScript Warnings. If you run a official release you can use the javascript.options.strict pref which can be set by entering about:config in the Location and hitting enter.
More info...
Cookie Control
Most web sites and web applications nowadays are using cookies. Debugging cookies can be a problem. But not if you use Mozilla.In Internet Explorer you can't see the current cookies. At least not from within Internet Explorer. So if you're using Internet Explorer the only option you have from within Internet Explorer is to delete all current cookies. If you want to delete all cookies from a specific domain you have to manually delete the Internet Explorer cookie files which are located in the %USERPROFILE%\Cookies directory (using Windows XP). Since the files are in a unknown text format I'm not sure it you can delete or edit specific cookies from a site or domain.
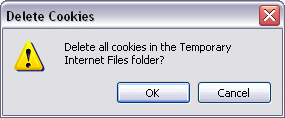
Picture 4: Cookie Manager in Internet Explorer
With Mozilla it's all different. You have full control over the cookies. Both when they are being set and after. You can use the Cookie Manager to see all the currently set cookies. From the Cookie Manager you can delete selected cookies.
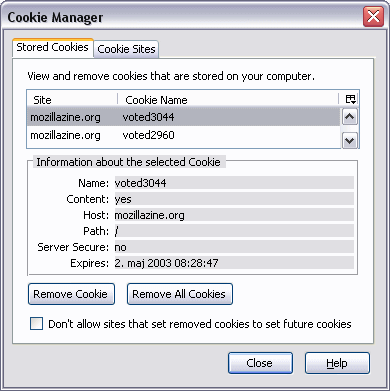
Picture 5: Cookie Manager in Mozilla
Both browser have dialogs to get control over which cookies should be set and which should be blocked. The dialogs look almost identical. But Mozilla's is a bit better. It remembers the state of the cookie information. If you left the more information part open it will stay open the next time the dialog comes up. In Internet Explorer you have to press the More Info button everytime.
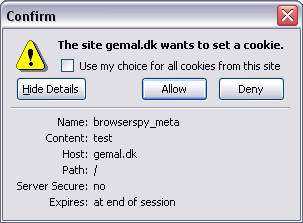
Picture 6: Cookie Dialog in Mozilla
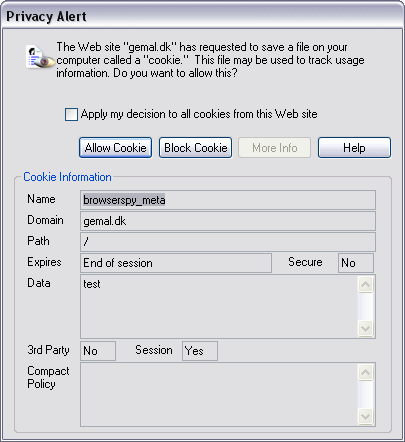
Picture 7: Cookie Dialog in Internet Explorer
View Source with Color Highlight
One of the most used features of web developers is the view source. Mozilla has some very nice color coding features while you have to look elsewhere to get the same in Internet Explorer.Internet Explorer defaults to showing view source with Notepad. Notepad is the most simple application in the entire Windows environment. A very very simple text editor.
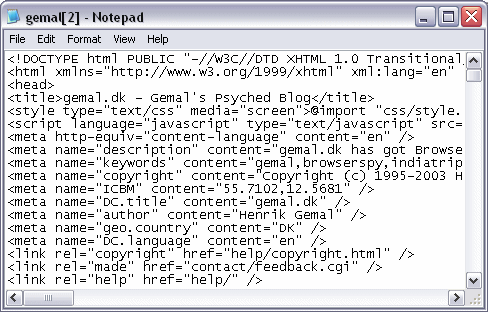
Picture 8: Notepad with the source of gemal.dk
In Mozilla you use the built in view source feature, which has color coding. This makes is very easy to get a quick overview of the structure of the HTML file.
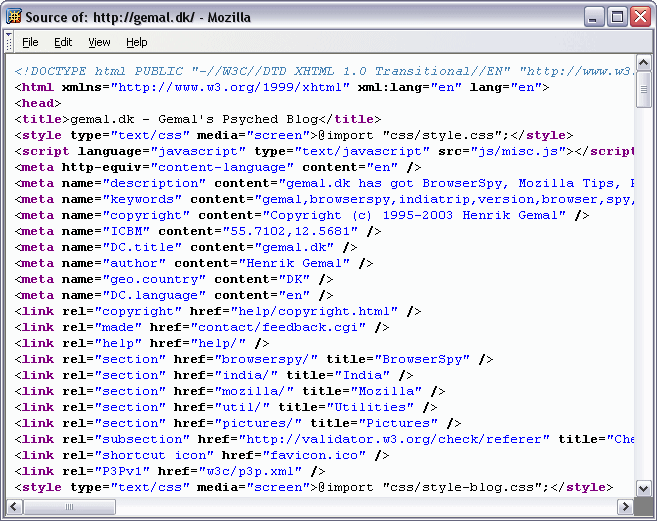
Picture 9: View Source with Color Highlight of the source of gemal.dk
The View Source can be seen via View -> Page Source.
View Selection Source
If you use document.write in your JavaScript, then you are probably familiar with the problem of not being able to see the content generated by it.The problem normally arises when you write out HTML tags from inside JavaScript. In Internet Explorer it's very difficult to see the produced HTML from the scripts. You can only see the script itself. The problem is normally fixed by using a lot of JavaScript alerts.
But Mozilla has a very nice feature can can save you a lot of alert commands. It's called View Selection Source. Mark the text you want to see the source for and right-click and select View Selection Source. Netscape 4 had a similar option. There also improvements being worked on for the View Source window so that it can switch between generated and source HTML.
The following is an example where the quote is placed the wrong place and it's almost impossible to find without the selection source option.
for (var i = 0; i < 10; i++) {
  document.writeln('<span id="id-"' + i + '">test: ' + i + '</span>');
  for (var j = 0; j < 5; j++) {
    document.write(j + '<br>');
  }
}
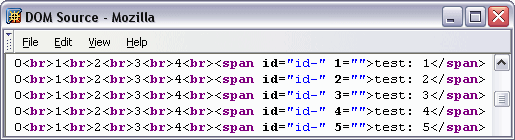
Picture 10: The source of a selection
Page Info
Both Internet Explorer and Mozilla have the ability to show the properties about the current page.In Internet Explorer this is done via File -> Properties. The information show is very limited.
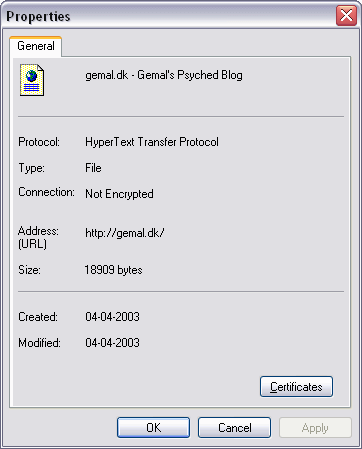
Picture 11: Page info in Internet Explorer
In Mozilla you have access to a whole bunch of information about the current page.
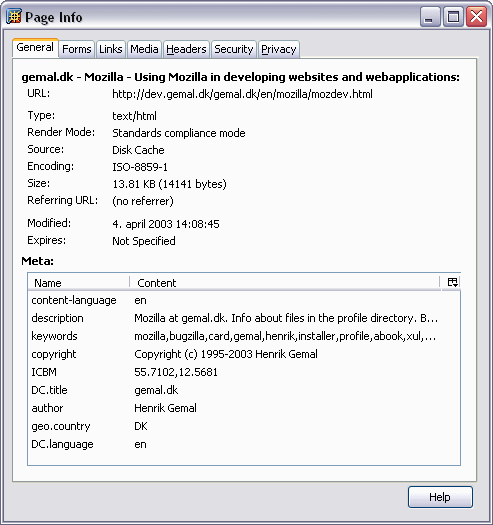
Picture 12: Page info in Mozilla
The Page Info can be seen via View -> Page Info.
JavaScript Debugger
Venkman is Mozilla's JavaScript Debugger. Venkman provides a powerful JavaScript debugging environment. Venkman is both a GUI and a console debugger. Features such as breakpoint management, call stack inspection, and variable/object inspection are available from the user interface and as console commands, letting you work in the way you feel comfortable. The interactive console also allows for execution of arbitrary JavaScript code. Venkman's keyboard shortcuts are the same as leading visual debugging environments, and gdb users should be familiar with Venkman's break, step, next, finish, frame, and where commands.
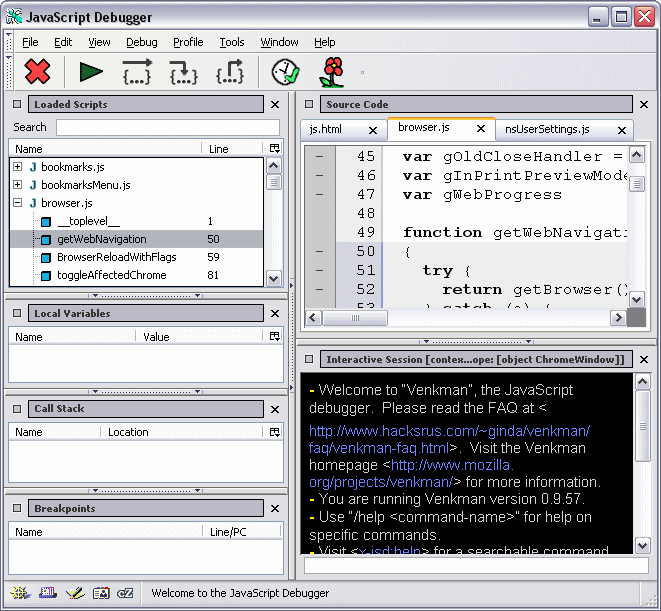
Picture 13: Mozilla's JavaScript Debugger
The JavaScript Debugger also supports profiling. Profiling can be used to measure execution times for your JavaScripts.
The JavaScript Debugger can be started via Tools -> Web Development -> JavaScript Debugger.
More info...
HTTP Headers
One of the best extensions to Mozilla is the Live HTTP Headers. This extension gives you the ability to view the HTTP headers that are passed between your browser and the web server. If you for example are trying to debug a cookie problem or a MIME header problem you can view all the details of the HTTP headers with this extension.
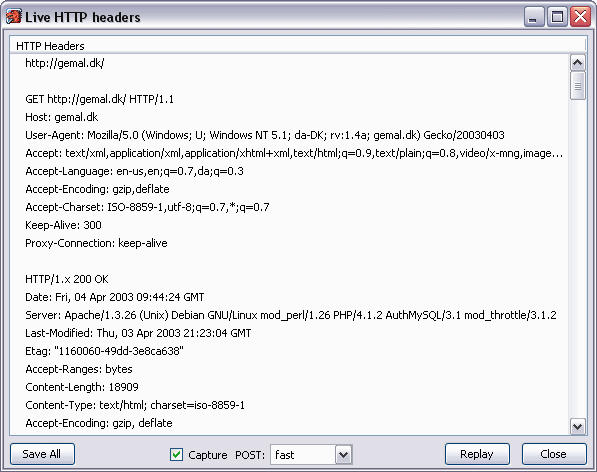
Picture 14: Live HTTP Headers console
Once installed the Live HTTP Headers can be started via Tools -> Web Development -> Live HTTP Headers or View -> Page Info -> Headers.
More info...
DOM Inspector
DOM Inspector is a tool that can be used to inspect and edit the live DOM of any web document or XUL application. The DOM hierarchy can be navigated using a two or three paned window that allows for a variety of different views on the document and all nodes within. You can also view style sheets, rules, etc, not just DOM.In the screenshot below you can see that a red square with the text Home is highlighted. This text is shown in the DOM tree.
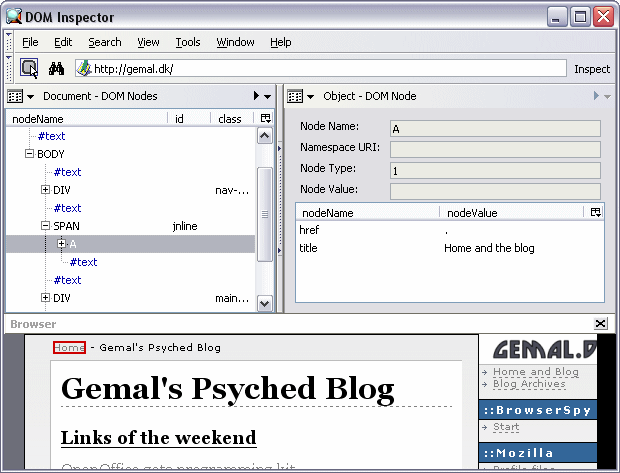
Picture 15: Mozilla's DOM Inspector
The DOM Inspector can be started via Tools -> Web Development -> DOM Inspector.
More info...
Cache Manager
The cache manager in Mozilla provides you with full access to see what's in the memory and disk cache. You can see all kind of details about all cache entires. This could, for example, help you, as a developer, to verify that the headers sent out by a web application are correct.
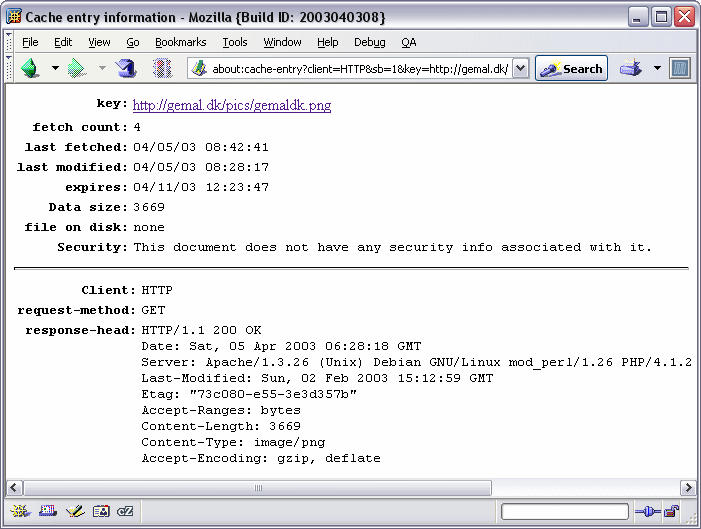
Picture 16: Cache Manager entry in Mozilla
The Cache Manager can be started by entering about:cache in the Location and hitting enter.